
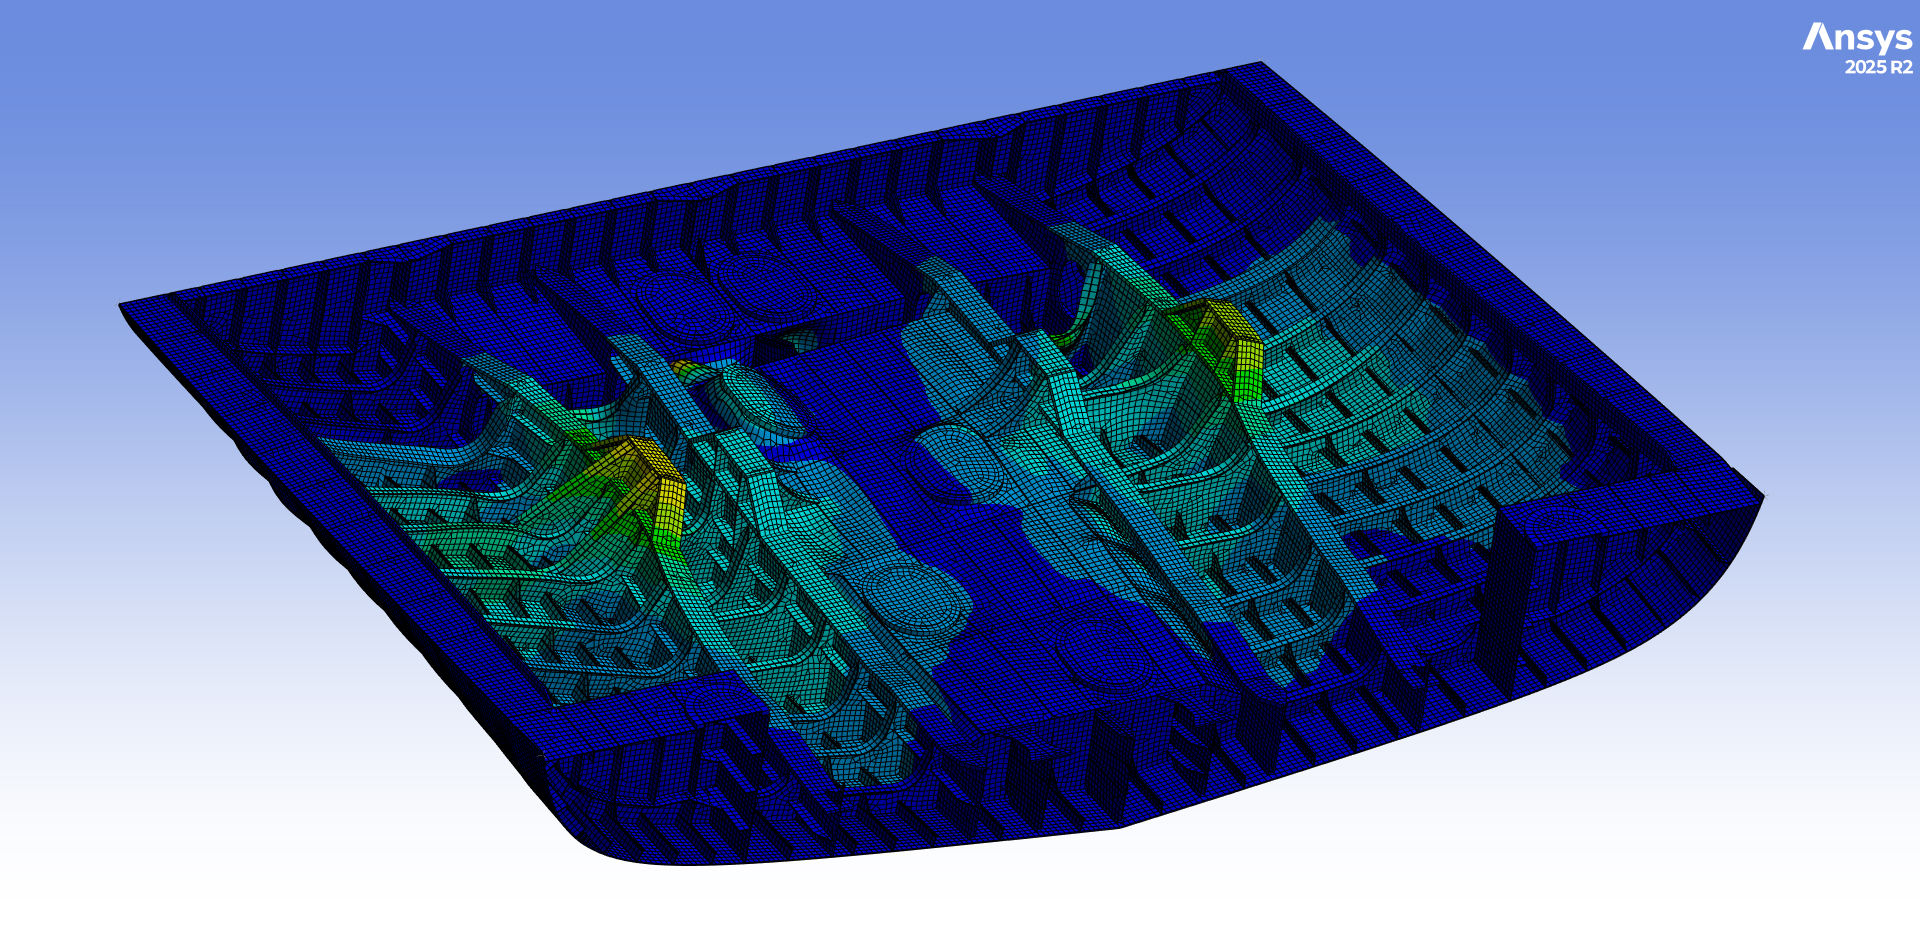
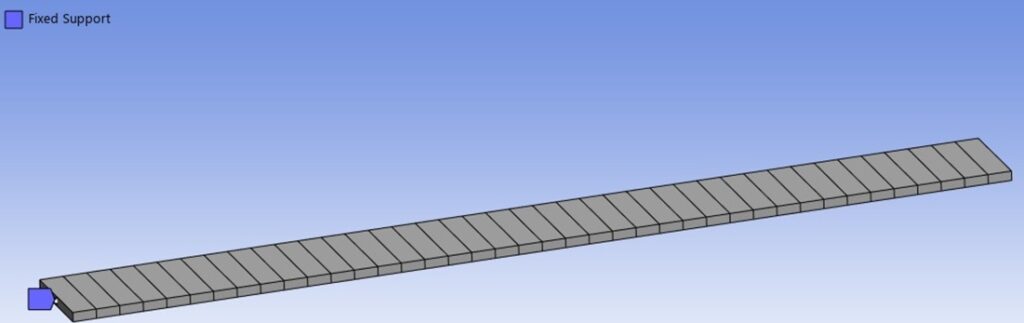
The next step in studying Vibration Mechanics is to abandon the study of so-called “lumped-parameter” systems—that is, theoretical systems consisting of masses and springs—and instead study the behavior of real structures, where mass, elasticity, and damping are continuously distributed. Let’s analyze the simple case of a cantilever beam, constrained at one end; an example of a simple FEM representation is shown.
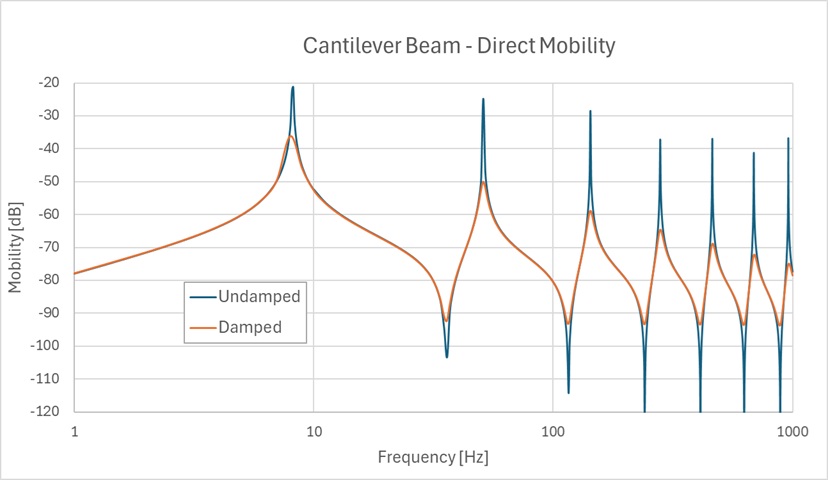
Structural Dynamics shows us that even a simple structure like this one, in the absence of external excitations, has an infinite number of natural vibration modes at corresponding increasing natural frequencies.
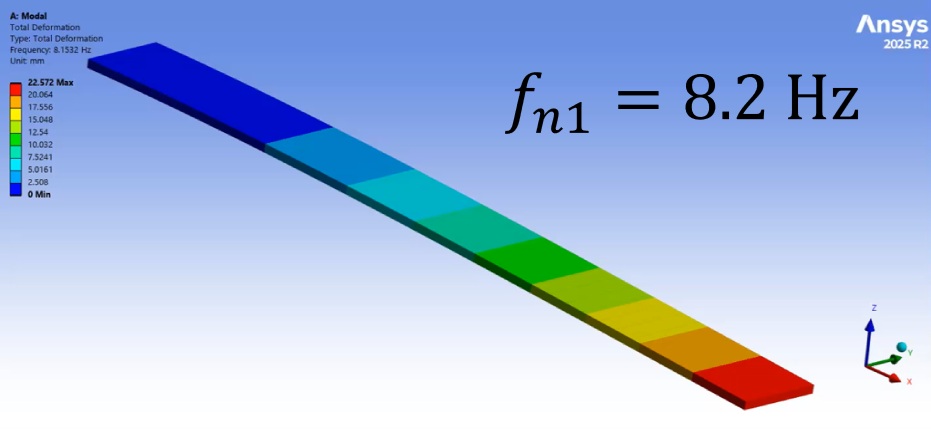
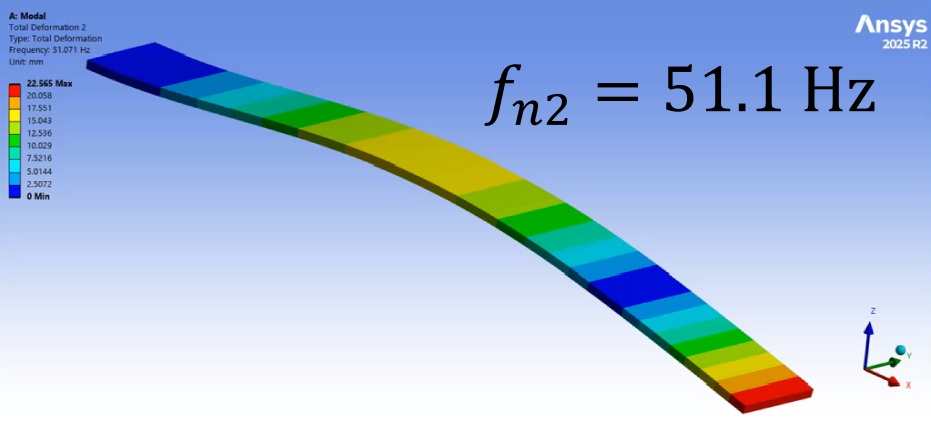
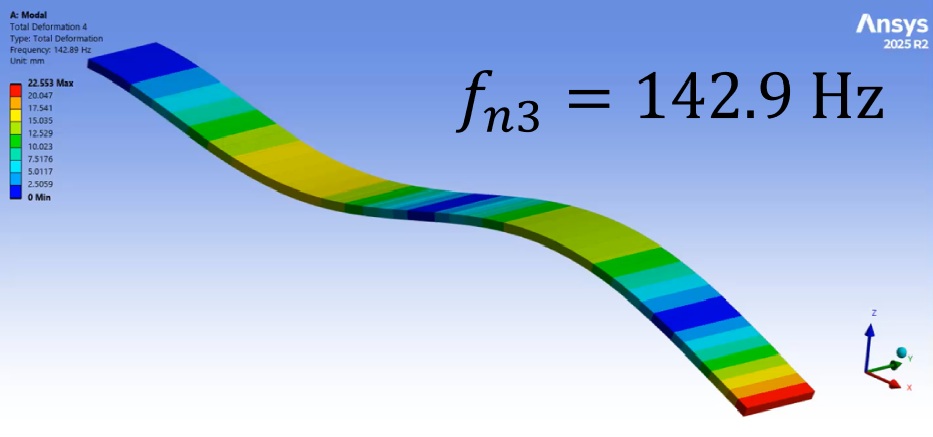
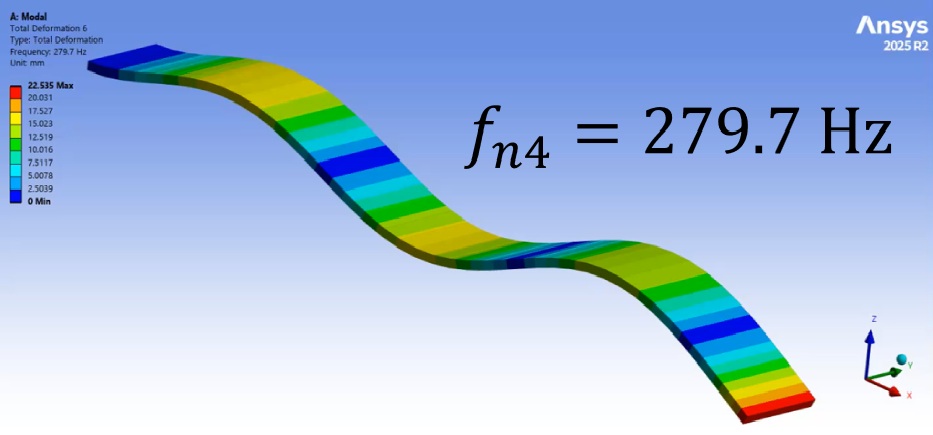
Modal analysis provides us with both natural frequencies and their corresponding mode shapes. The first mode, with the lowest natural frequency, is the simplest and corresponds to a mode shape with a single curvature. The higher modes occur at increasing frequencies, with increasingly complex deformations, with areas of the beam that correspond to nodes of the vibration (therefore stationary, colored in blue), or antinodes (maximum deformation).
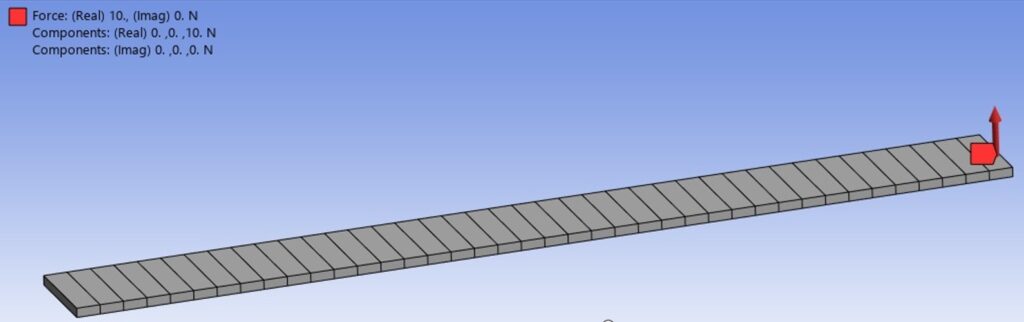
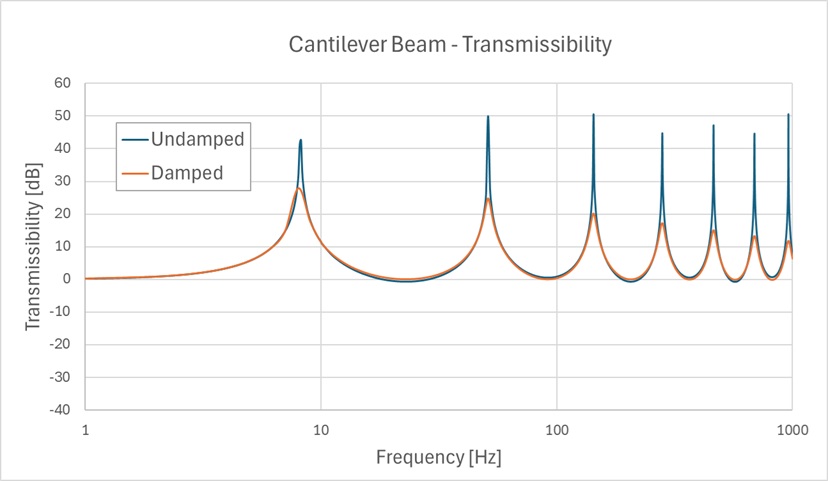
If we excite the cantilever beam at its free end, for example with a vertical harmonic force, in steady state we will also have harmonic oscillations of the structure at the same frequency as the force.
Structural Dynamics shows us that even a simple structure like this one, in the absence of external excitations, has an infinite number of natural vibration modes at corresponding increasing natural frequencies.
These concepts can be extended to complex structures, such as the one we see represented below. It’s the hull portion corresponding to the engine room of a yacht of approximately 50 meters. The aim of analyzing these structures is to verify by calculation whether they are sufficiently rigid at the points that will be in contact with the main sources of structural noise, in particular the connection points with the propulsion system. The test therefore consists in calculating the mobility at these points and ensuring that it is sufficiently low across the entire frequency range of interest.
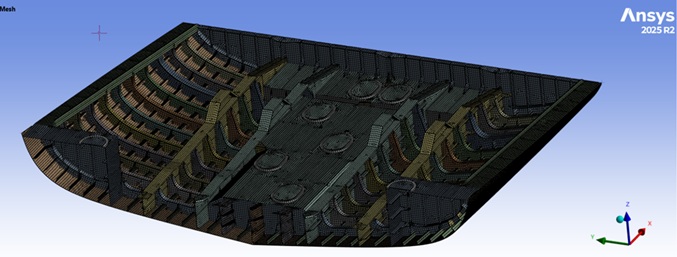
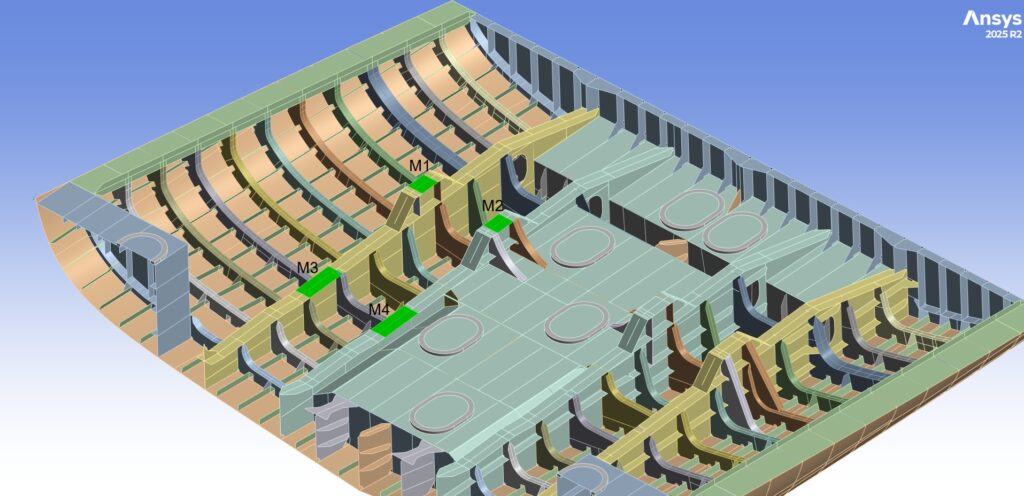
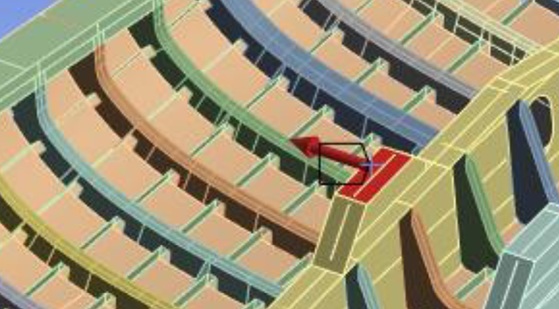
Therefore, an FEM model of the structure is created, appropriately constrained, and harmonic forces are applied at the points and directions of interest. In the example considered, the points of application of the excitations are indicated by the color green. These are the surfaces to which the anti-vibration mounts that support the powertrain will then be attached, in this case the engine and gearbox in a close-coupled configuration. In the example, a unit harmonic force (1 kN) was applied in the transverse direction, with a frequency varying from 0 to 800 Hz.
The analysis results in the curves contained in the following two diagrams; in each, the lower curves indicate the direct mobility at the four foundation points considered. These curves are compared with the mobility curve of the anti-vibration mount (blue curve), an intrinsic property of the selected elastic support.
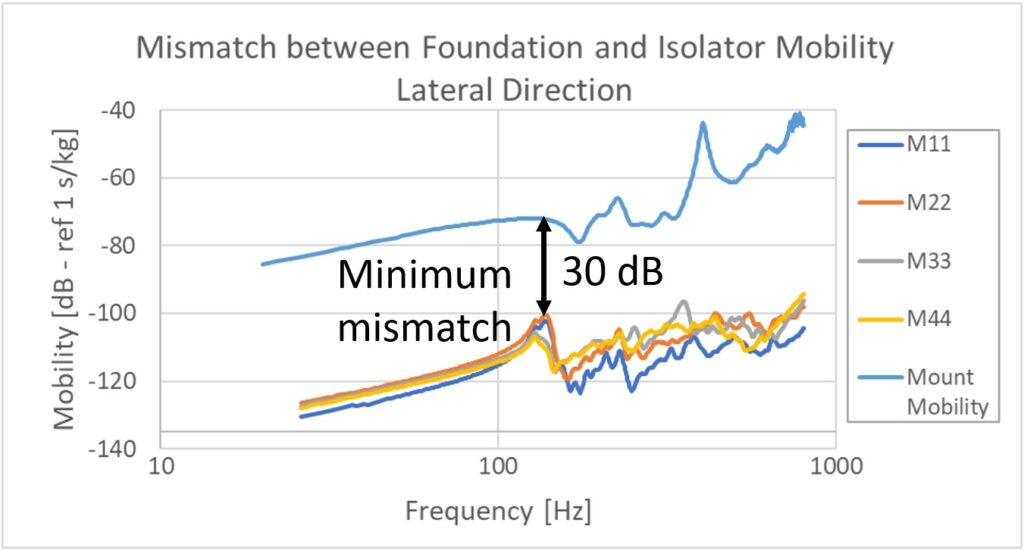
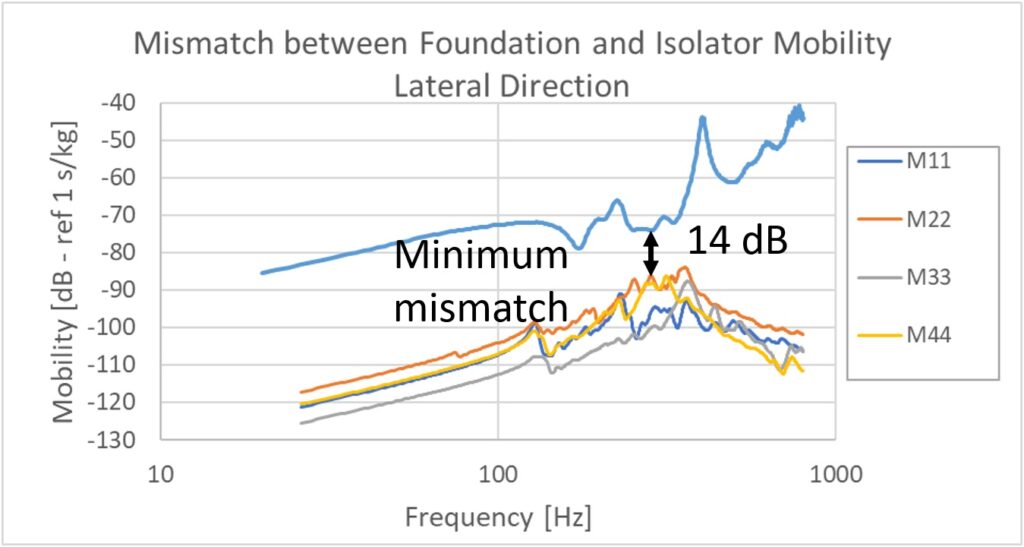
Ideally, for a correct foundation design and an adequate selection of the elastic suspension, the mobility curves of the foundation should be significantly lower than the mobility of the anti-vibration mount, which should constitute the least rigid component of the path followed by the structural noise.
It is evident that the foundation’s mobility curves exhibit several peaks, due to the structure’s natural modes. The anti-vibration mount’s mobility curve is also linear at low frequencies. At medium-high frequencies, oscillations occur due to the appearance of elastic wave propagation phenomena inside the anti-vibration mount which alter its ideal behavior.
For a correctly designed foundation, there should be a mismatch between the mobility curves of the anti-vibration mount and those of the foundation of at least 25-30 dB across the entire frequency range of interest. The two diagrams indicate one in which this condition is verified, indicating a correctly designed structure, and one in which this condition is not verified, indicating a structure that is not sufficiently rigid in the frequency range of interest.